Getting Started with Crosslight Charting
One of the greatest new components in Crosslight 4 is a powerful, full-fledged Charting component, enabling Crosslight developers to easily add stunning charts to their business cross-platform mobile apps. Fully MVVM capable, it works beautifully across iOS and Android platforms.

Have you checked out the new Crosslight Charting yet? If not, then this post is the perfect guide for you. This post will help you learn how to get started with Crosslight Charting.
Starting Off
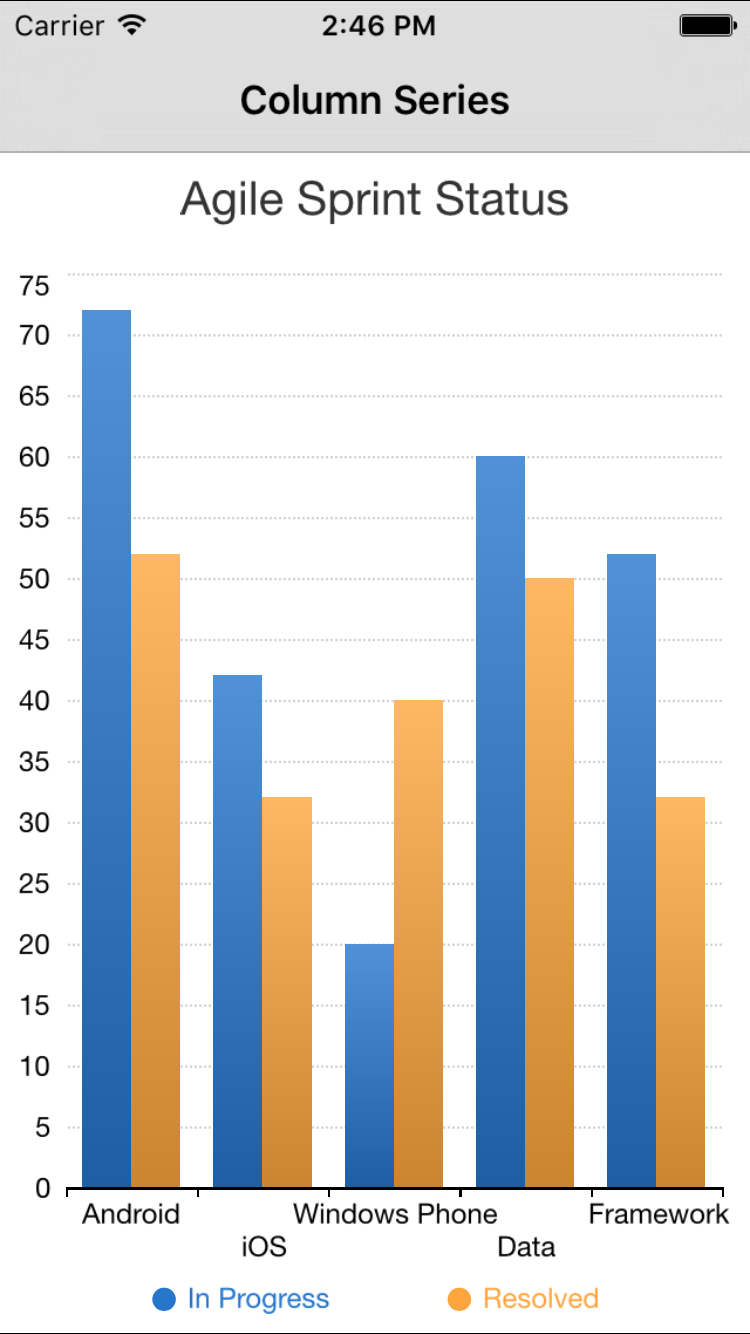
Let’s try to create the illustrated column chart from scratch. To start off, I created a Blank Crosslight project with Crosslight Project Wizard. I’ll call this CrosslightCharting for now. After the project is created, don’t forget to add the necessary references as well.

Necessary References
- Core project: Add Intersoft.Crosslight.UI.DataVisualization assembly.
- iOS project: Add Intersoft.Crosslight.UI.DataVisualization and Intersoft.Crosslight.UI.DataVisualization.iOS assembly.
- Android project: Add Intersoft.Crosslight.UI.DataVisualization and Intersoft.Crosslight.UI.DataVisualization.Android assembly.
Now you’re ready to begin writing some codes.
Preparing the ViewModel
Let’s prepare the ViewModel that will provide the data to the chart. I’m going to create a ColumnViewModel class inside the CrosslightCharting.Core/ViewModels folder, and write really simple code to initialize the Chart model. Here’s how.
|
1 2 3 4 5 6 7 8 9 10 11 12 13 14 15 16 17 18 19 20 21 22 23 24 25 26 27 28 29 30 31 32 33 34 35 36 37 38 39 40 41 42 43 44 45 46 47 48 |
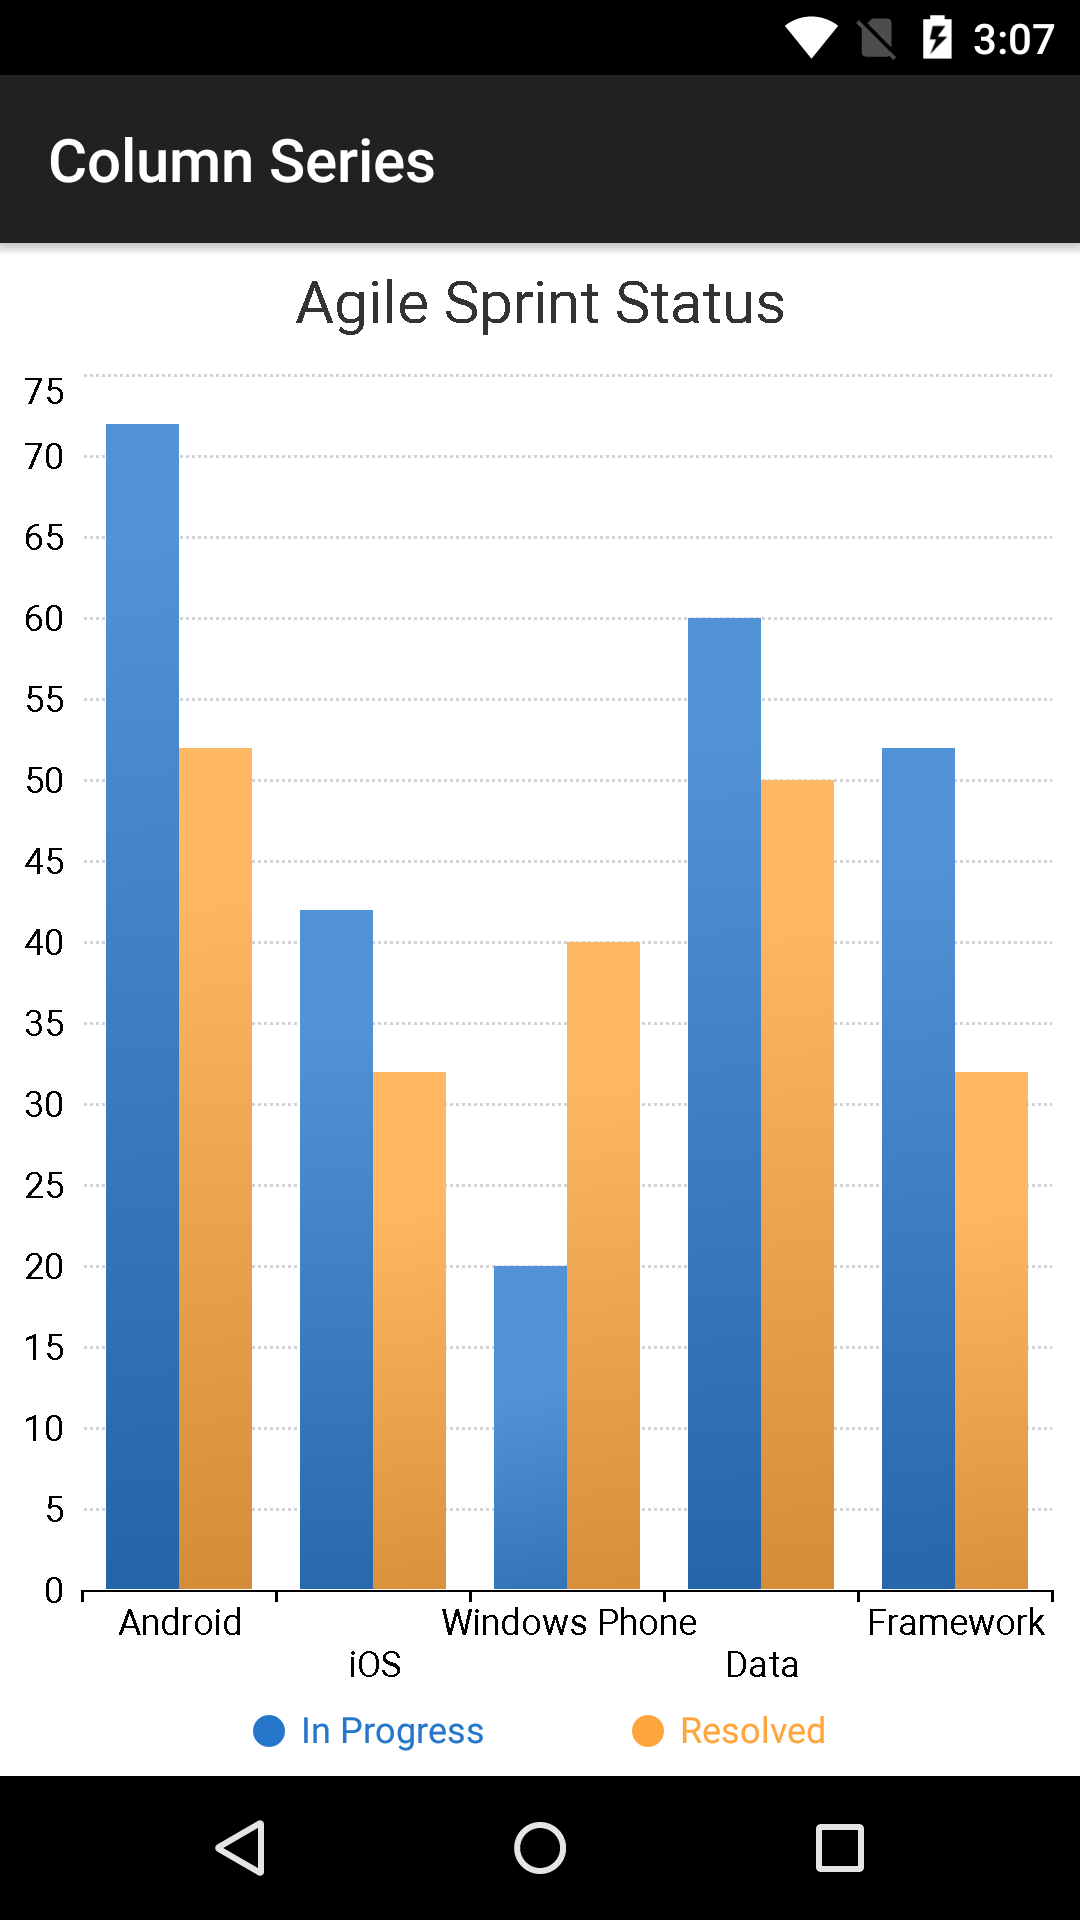
using Intersoft.Crosslight.UI.DataVisualization; using Intersoft.Crosslight.ViewModels; namespace CrosslightCharting.Core { public class ColumnViewModel : ViewModelBase<ColumnSeries> { private Chart _chart; public Chart Chart { get { return _chart; } set { _chart = value; OnPropertyChanged("Chart"); } } public ColumnViewModel() { InitializeChart(); } private void InitializeChart() { this.Chart = new Chart(); this.Chart.Title.Text = "Agile Sprint Status"; // setup series for In Progress Series inProgressSeries = new ColumnSeries(); inProgressSeries.Title = "In Progress"; inProgressSeries.Items = new List<DataPoint>(); inProgressSeries.Items.Add(new DataPoint("Android", 70)); inProgressSeries.Items.Add(new DataPoint("iOS", 42)); inProgressSeries.Items.Add(new DataPoint("WinPhone", 20)); this.Chart.Series.Add(inProgressSeries); // setup series for Resolved Series resolvedSeries = new ColumnSeries(); resolvedSeries.Title = "Resolved"; resolvedSeries.Items.Add(new DataPoint("Android", 53)); resolvedSeries.Items.Add(new DataPoint("iOS", 32)); resolvedSeries.Items.Add(new DataPoint("WinPhone", 40)); this.Chart.Series.Add(resolvedSeries); } } } |
As you can see, all we did is simply initializing the chart in the ViewModel and populated two ColumnSeries for it, and add the data points for each series which will be displayed side-by-side. Crosslight Charting library includes component models that you can consume in the shared Core project. The Chart model represents the data source required for the chart, and also provides a wealth of chart configuration and settings. The Series, ColumnSeries, and DataPoint are another example of the component models available in the Charting library.
For the sake of simplicity, the above sample uses static data points as the items source for each series. If your data points are heavily reused across your application, you can definitely refactor the data points into a repository or data manager class which you can easily consume with a simple method call. Later, you can learn more about it from my sample project.
It’s also noteworthy to point out that changes to the Chart model will automatically propagated to the view, thanks to the powerful binding architecture of Crosslight. This means you can add or remove Series dynamically in your app. Of course, you can also set the items source of the Series later in the app’s cycle, such as after fetching data from the server in most real-world scenarios. Better yet, changes you made to the Chart model will not be only propagated to the view, they will be also smoothly animated from the current point to the new point. Absolutely no additional code needed, it just works!
For your reference, here’s a code snippet how to initialize the items source of a Series combined with an async data load.
|
1 2 3 4 |
protected override async void Navigated(NavigatedParameter parameter) { this.Chart.Series.First().Items = await this.Repository.GetAgileStatusAsync("In Progress"); } |
That’s pretty cool, right?
Crosslight Charting emphasizes not only on powerful charting capabilities, but also provides developers with easy-to-use and intuitive APIs, so you can get things done without having to worry about the heavy work. If you notice, you don’t necessarily need to define the dependent and independent axes for the chart, since Crosslight Charting comes with automatic axis detection that generates meaningful axis and range, purely based on the given data. Simply beautiful.
Preparing the BindingProvider
Since our ViewModel and Chart model is ready, let’s prepare the Binding Provider which will bind the Chart model to the view. This is where the magic will happen.
Simply create a new Crosslight Binding Provider using the item templates built into Visual Studio (Windows) or Xamarin Studio (Mac). I’ll call this ColumnBindingProvider, and I’ll put it inside the CrosslightCharting.Core/BindingProviders folder.
|
1 2 3 4 5 6 7 8 9 10 11 12 13 14 15 16 17 18 19 20 21 |
#region Usings using Intersoft.Crosslight; using Intersoft.Crosslight.UI.DataVisualization; #endregion namespace CrosslightCharting.Core { public class ColumnBindingProvider : BindingProvider { #region Constructors public ColumnBindingProvider() { this.AddBinding("ChartView", ChartProperties.ChartProperty, new BindingDescription("Chart", BindingMode.TwoWay)); } #endregion } } |
There’s not much to explain here as the code is self explanatory. It simply binds the ChartView to the Chart property of the ViewModel. That’s it. Now you have the ViewModel with complete data populated as well as the BindingProvider.
Creating the Chart for iOS
You’re now ready to create the ViewController that will host the chart in iOS. I’ll create a new ViewController called ColumnViewController inside the CrosslightCharting.iOS/ViewControllers folder. Here’s the ColumnViewController file:
|
1 2 3 4 5 6 7 8 9 10 11 12 13 14 15 16 17 18 19 20 21 |
#region Usings using CrosslightCharting.Core; using Intersoft.Crosslight; using Intersoft.Crosslight.UI.DataVisualization.iOS; #endregion namespace CrosslightCharting.iOS { [ImportBinding(typeof(ColumnBindingProvider))] public partial class ColumnViewController : UIChartViewController<ColumnViewModel> { protected override void InitializeView() { base.InitializeView(); this.NavigationItem.Title = "Column Series"; } } } |
As you see from the code above, the ViewController contains almost nothing except for the BindingProvider and the ViewModel I’ve just created before. Also note that you need to subclass the UIChartViewController class. The UIChartViewController provides a ChartView property which returns the instance of UIChartView that it manages. It also automatically registers the ChartView as an identifier, allowing you to easily bind to the chart view in the binding provider.
Simply run the project to see the Crosslight Charting in action.
You’ve just created your first Crosslight Charting application in iOS. Congratulations! Well, how about the Android platform?
Creating the Chart for Android
Well, since you’ve prepared the ViewModel and the BindingProvider, so, as you guessed it, all you need to do, is just to provide the “view” for Android platform. Let’s create an Activity for that. I’ll call it ColumnActivity, and put it inside the CrosslightCharting.Android/Activities folder.
|
1 2 3 4 5 6 7 8 9 10 11 12 13 14 15 16 17 18 19 20 21 22 23 24 |
#region Usings using Android.App; using Intersoft.Crosslight.Android; using CrosslightCharting.Core; using Intersoft.Crosslight; #endregion namespace CrosslightCharting.Android { [Activity(Label = "Column Series")] [ImportBinding(typeof(ColumnBindingProvider))] public class ColumnActivity : Activity<ColumnViewModel> { protected override int ContentLayoutId { get { return Resource.Layout.ColumnSeriesLayout; } } } } |
Again, nothing’s here except for the ViewModel and the BindingProvider we’ve created earlier. As you can see, I’ve provided a layout for this activity by creating an Android layout file inside the CrosslightCharting.Android/Resources/Layout folder, called ColumnSeriesLayout.axml. Let’s see how this file looks like.
|
1 2 3 4 5 6 7 8 9 10 11 12 |
<?xml version="1.0" encoding="utf-8"?> <LinearLayout xmlns:android="http://schemas.android.com/apk/res/android" android:orientation="vertical" android:layout_width="fill_parent" android:layout_height="fill_parent" android:background="@android:color/white" android:gravity="center"> <Intersoft.Crosslight.UI.DataVisualization.Android.ChartView android:layout_width="fill_parent" android:layout_height="fill_parent" android:id="@+id/ChartView" /> </LinearLayout> |
The layout is simply a ChartView that covers the entire screen. I’ve also put a white background to get better visibility of the chart. Android version is done. Let’s see it in action.
Now, I want you to pay attention to how Crosslight Charting manages to create the axes automatically for you, and define the “smart” ranges for those axes that fits the screen nicely. Also notice that the legend is automatically generated for you based on the given data points. How cool is that? See, I told you that it works consistently between iOS and Android platform.
And if you need to customize anything about the Chart, whether its data source, series, or other settings, you do it only once in the ViewModel. At this point, I hope you’ve started to get the point how Crosslight works in overall, and how it lives to its highly acclaimed 100% shared UI logic.
Learning more about Crosslight Charting
You’ve successfully created a column chart with Crosslight Charting. In addition to column charts, Crosslight Charting also supports many other chart types such as area, bar, doughnut, line, pie, scatter, step area, and much more.
If you’re interested in learning more, I highly suggest you to check out the list of topics here:
- Understanding chart series
- Understanding chart axis
- Understanding chart legend
- Understanding chart title
- Configuring chart appearance
- Understanding animation
- Enabling zoom
- Using data annotation
I also highly recommend you to check out the samples directly to see all of the features hands-on. It is available in the Git repository in this link.
You can also find the source code to this our Git repository here.
Till next post,
Cheers
Nicholas Lie