Create a Simple Report with Intersoft ClientUI Reporting
In the previous posts, I’ve wrote about the overview and features of our new ClientUI reporting lineup. Now that we’ve released the Reporting lineup, you can download a copy of the new 2013 release here and test drive the much anticipated Reporting for yourself.
In this blog post, I will explain how to create a simple report using Intersoft Reporting. To get started, run the standalone Report Designer application which can be found in the Intersoft Premier Studio 2013 program group. The complete shortcut path can be found below.
|
1 |
C:ProgramDataMicrosoftWindowsStart MenuProgramsIntersoft Premier Studio 2013 R1WebUI Studio for Silverlight 5Reporting |
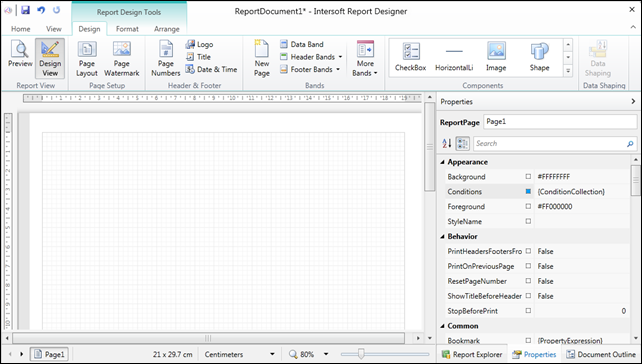
Once launched, you will see the Report Designer running in the browser that looks like the following:
Reporting is all about presenting data from a specific datasource. So before we started designing a report, let’s define the data source and related data definitions first.
Defining Data Definitions
Before performing data definitions tasks, it’s important to understand the ClientUI reporting data management concept. At the heart of the ClientUI reporting is the entity-based data source, which can be any objects – a simple POCO object or a complex domain model object. This means that it doesn’t coupled to any specific data providers. You can simply get the data the way you want and throw in into the report’s data source. The report viewer will take care the rest.
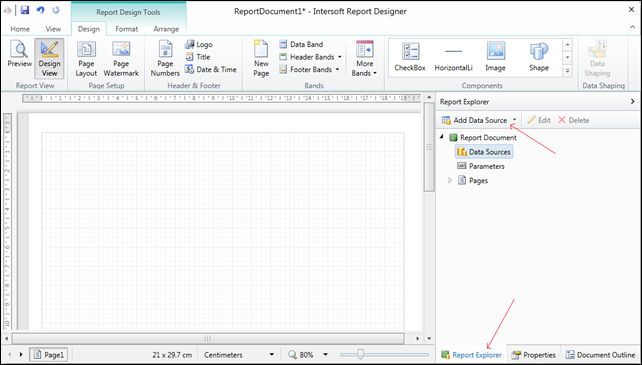
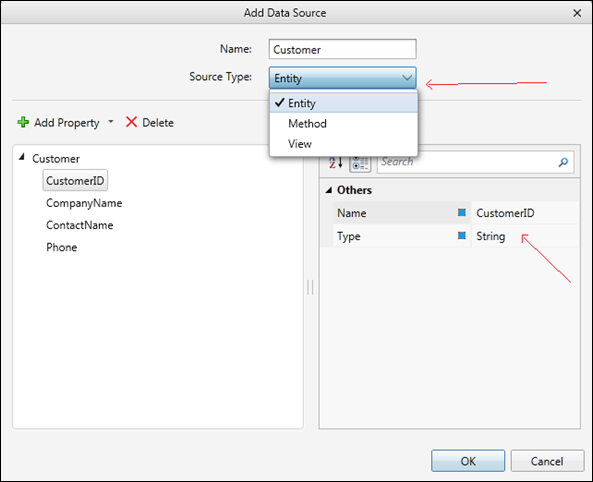
Back to the report designer. You can easily define data source by simply navigating to the Report Explorer tab, then click the AddDataSource button. This will launch a dialog to add a new data source. See the following illustration.
You need to specify the name and type of your data source. Actually there are 3 data source types you can use here, such as Entity (table), Method (Stored Procedure), or View. In this scenario, an Entity will be provided as a data source. Also don’t forget, you need to specify the properties owned by your data source, including it’s name and type.
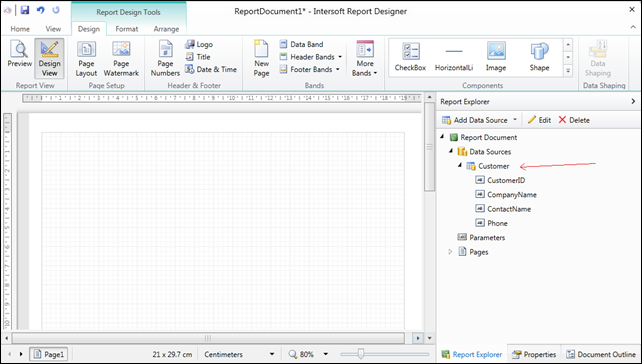
After added, now your Report Explorer tab will look like the following:
Designing the Report
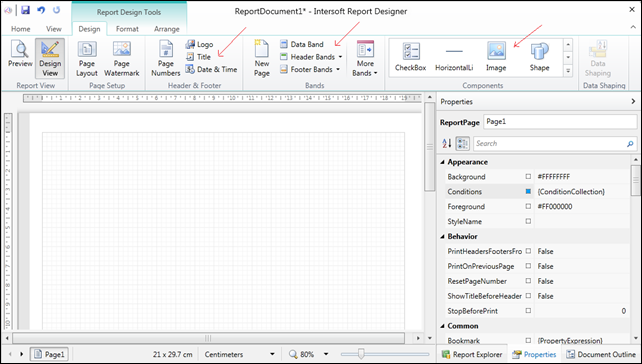
Most functionalities you need to design a report can be easily accessed from the ribbon. From the ribbon, you can easily insert a title, logo, watermark, band, or report component into the design surface.
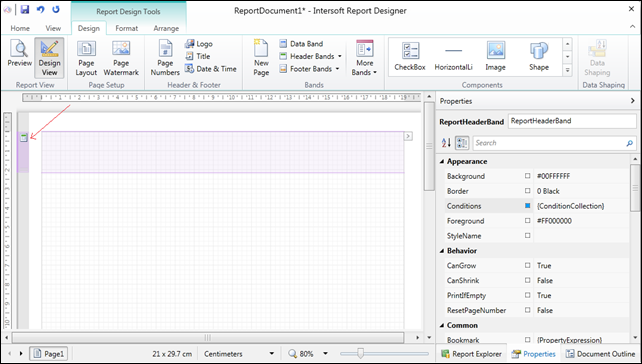
First, let’s insert a ReportHeaderBand into the design surface. A report header will be printed once in a report, so it’s the best place for the report’s title or logo. You will notice that a visual adorner is attached to the left side of the band. The adorner allow you to re-positioning the band by using drag-drop. Besides that, you will also find a resize grip at the bottom side of the visual adorner. See the following screenshot.
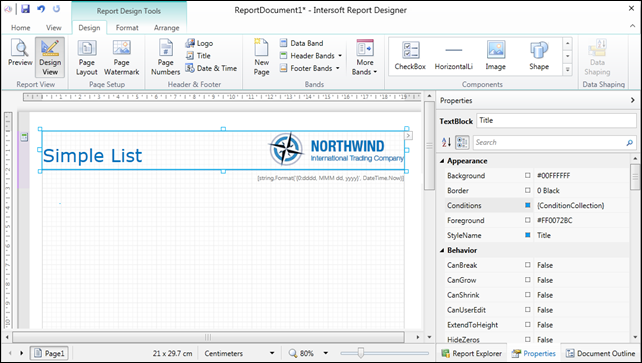
Next, insert the logo. Simply click the ‘Logo’ button and a file dialog will be appeared which require you to specify an image file. Then click the ‘Title’ and ‘Date & Time’ button to insert the report’s title and date. Suppose you need to customize it, you can done these easily from the property grid.
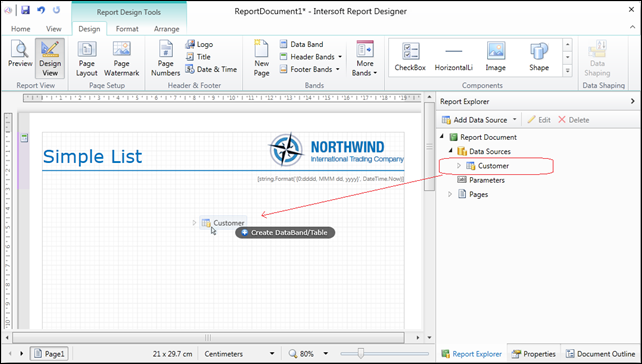
The next step is to display data in a report. Drag the data source which has been created before and drop it into the design surface. See the illustration below.
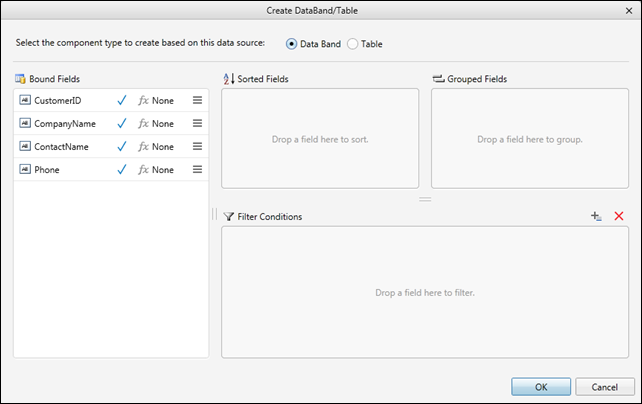
A dialog will be appeared, require you to specify which columns will be displayed in the report. Also you can define filter, sort, or group definitions in there by using drag-drop. See the following screenshot.
Once the dialog is committed, a DataBand and it’s related band, such as HeaderBand, FooterBand, GroupHeaderBand, and GroupFooterBand, will be inserted automatically.
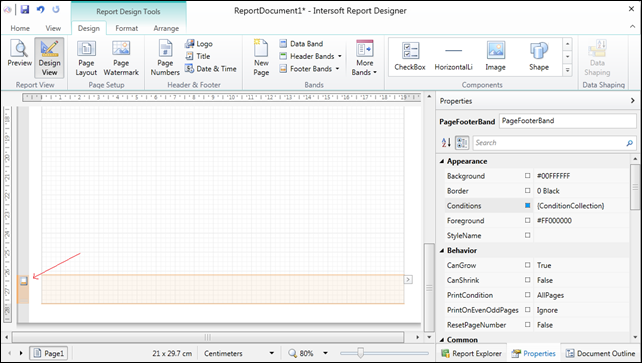
Last, we will printed an image at the bottom of every report pages. In this scenario, a PageFooterBand will be used because page footer will be printed at the bottom of every pages.
Insert an Image to the PageFooterBand, like the screenshot below.
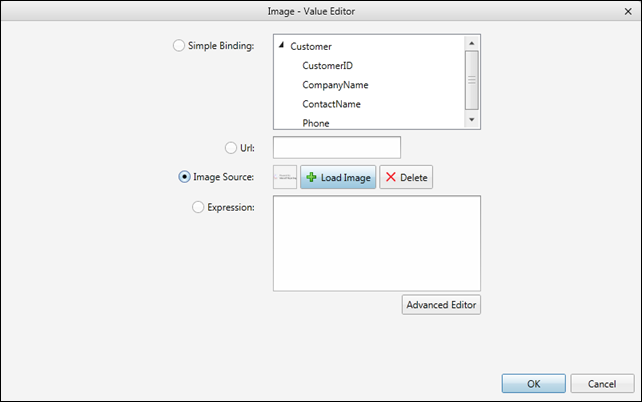
Double click on the Image, then a dialog will be appeared and you need to provide the image source. See screenshot below.
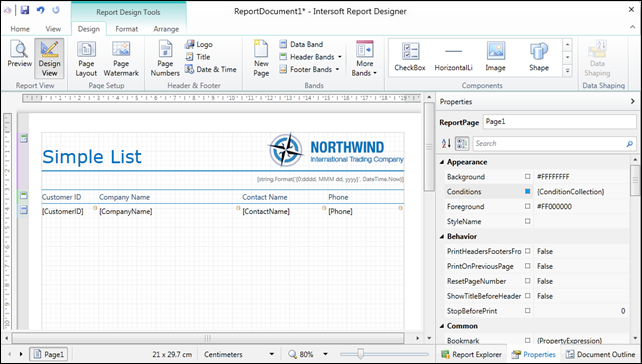
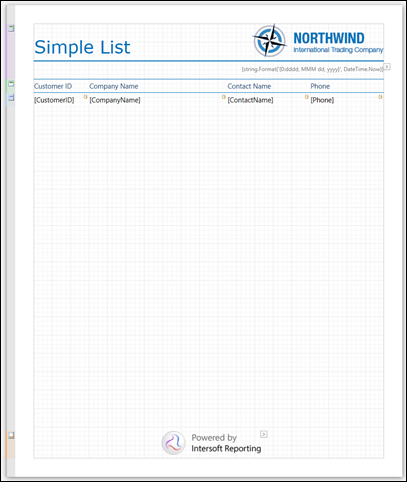
After following those steps, your final report document will actually look like the following screenshot. Try to preview the report or open it using Intersoft ReportViewer, and don’t forget to save the report document for further usage.
Displaying Report with Intersoft Report Viewer
In this section, we will open the saved report document using Intersoft Report Viewer. First, you need to create a simple Silverlight application. Then define the ReportViewer in your View like the following code:
|
1 2 3 4 |
<Intersoft:ReportViewer x:Name="ReportViewer" ReportUri="{Binding ReportUri}" ReportDefinition="{Binding ReportDefinition, Mode=TwoWay}" ReportDataProvider="{Binding ReportDataProvider}"/> |
Then provide the ViewModel. See the following code:
|
1 2 3 4 5 6 7 8 9 10 11 12 13 14 15 16 17 18 19 20 21 22 23 24 25 26 27 28 29 30 31 32 33 34 35 36 37 38 39 40 41 42 43 44 45 46 47 |
public class MainPageViewModel { private Uri _reportUri; private ReportDefinition _reportDefinition; private ReportDataProvider _reportDataProvider; public Uri ReportUri { get { return _reportUri; } set { if (_reportUri!= value) { _reportUri= value; this.OnPropertyChanged("ReportUri"); } } } public ReportDefinition ReportDefinition { get { return _reportDefinition; } set { if (_reportDefinition != value) { _reportDefinition = value; this.OnPropertyChanged("ReportDefinition"); } } } public ReportDataProvider ReportDataProvider { get { return _reportDataProvider; } set { if (_reportDataProvider != value) { _reportDataProvider = value; this.OnPropertyChanged("ReportDataProvider"); } } } public MainPageViewModel() { this.ReportUri = new Uri("Reports/SimpleReport.xaml", UriKind.Relative); this.ReportDataProvider = new NorthwindDataProvider(); } } |
And don’t forget to define the report data provider. You need to derive it from ReportDataProvider class, and implement the ProvideData method. Make sure the provided data reflect the one which have been defined in your report document.
In this sample, we create a NorthwindDataProvider class which derives from the ReportDataProvider. The following code is provided for the sake of simplicity, you can obviously refactor it into a generic class and easily define the logic to get the data source using the preferred data service, i.e., WCF RIA Service or DevForce Service.
|
1 2 3 4 5 6 7 8 9 10 11 12 13 14 15 16 17 18 19 20 21 22 23 24 25 26 27 28 29 30 31 32 33 34 35 36 37 38 39 40 41 42 43 44 45 46 47 48 49 50 51 52 53 54 55 56 57 58 59 60 61 62 63 64 65 66 67 68 69 70 71 72 |
public class NorthwindDataProvider : ReportDataProvider { List<Func<INotifyCompleted>> operations = new List<Func<INotifyCompleted>>(); foreach (ObjectDataSource objectDataSource in reportDefinition.DataDefinitions.ObjectDataSources) { if (objectDataSource.IsRequired && !objectDataSource.IsLoaded) { Func<INotifyCompleted> op = this.GetQuery(reportDefinition, objectDataSource); if (op != null) operations.Add(op); } } Coroutine.StartParallel(operations, (op) => { this.MarkAsCompleted(); }); } private Func<INotifyCompleted> GetQuery(ReportDefinition reportDefinition, ObjectDataSource objectDataSource, QueryDescriptor queryDescriptor = null) { if (queryDescriptor == null) queryDescriptor = new QueryDescriptor(); queryDescriptor.SuspendQueryChanged = true; if (objectDataSource.ParsedFilterDescriptors.Count > 0) queryDescriptor.FilterDescriptors.Add(objectDataSource.ParsedFilterDescriptors); queryDescriptor.SuspendQueryChanged = false; if (queryDescriptor.FilterDescriptors.Count > 0) { CompositeFilterDescriptorCollection collection = queryDescriptor.FilterDescriptors.OfType<CompositeFilterDescriptorCollection>().FirstOrDefault(); List<FilterDescriptor> sorts = collection.OfType<FilterDescriptor>().Where(o => o.PropertyName == "SortBy").ToList(); if (sorts != null && sorts.Count > 0) { foreach (FilterDescriptor sort in sorts) { queryDescriptor.SortDescriptors.Add(new SortDescriptor() { PropertyName = sort.Value.ToString() }); } queryDescriptor.FilterDescriptors.Remove(collection); } } Action<IEnumerable> initializeData = this.InitializeData(reportDefinition, objectDataSource.Name); switch (objectDataSource.Name) { case "Customer": queryDescriptor.SortDescriptors.Add(new SortDescriptor() { PropertyName = "CustomerID" }); return () => this.DataManager.Customers.ExecuteAsync(queryDescriptor, initializeData); } return null; } private void AddDataSource(ReportDefinition reportDefinition, string objectDataSourceName, IEnumerable dataSource) { if (!reportDefinition.DataSources.ContainsKey(objectDataSourceName)) reportDefinition.DataSources.Add(objectDataSourceName, dataSource); else reportDefinition.DataSources[objectDataSourceName] = dataSource; } private Action<IEnumerable> InitializeData(ReportDefinition reportDefinition, string dataSourceName) { Action<IEnumerable> action = (results) => { this.AddDataSource(reportDefinition, dataSourceName, results); }; return action; } |
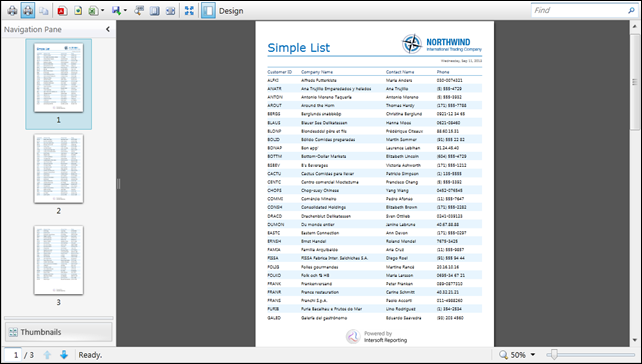
Run the ReportViewer, and the result will look like the following screenshot.
Conclusion
In this post, I have explained how to create a simple report using Intersoft Report Designer and open it using Intersoft Report Viewer. Once you have the provider and ViewModel ready, you can rapidly create reports and present them in your application. Now feel free to try and make your own report. Should you find any difficulties or have any feedback, feel free to drop us a line in the comment box.
Warm Regards,
Jack


Does the report designer and viewer have the Metro Theme implemented
In this release, we prioritized the industry-standards theme which fits the widest range of users. However, the architecture is already theme-able. This means that we can easily ship Modern UI theme as a separate assembly in the next update.