Pivot Charting
Powerful data analysis and visualization with simple implementation
Hi all, I’m going to brief about the latest feature in WebGrid.NET Enterprise® 6.0 which called Pivot Charting. By definition Pivot Charting is a powerful data analysis and visualization tool that enables you to present your dataset in multiple viewpoints.
Don’t confuse it with more complex business intelligent application such as Microsoft SQL Server 2005 analysis. The featured offered in WebGrid.NET Enterprise® 6.0 is a more simplified approach more like Microsoft Access 2007®.
Pivot Charting is not enabled by default. You’ll need to perform several steps to enable it.
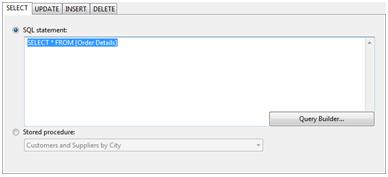
- Bind the WebGrid with a datasource. This datasource can be from a raw data retrieved using simple SELECT command, or a report data retrieved using complex query.

- After you bind the WebGrid with a datasource, the next thing to do is to decide how you would like your view mode. There are three types of mode available:

Allow Pivot Charting (with initial view = Grid View / Pivot Chart View)
Allow Pivot Charting means that you will have an option to switch between GridView and PivotChartViewWebGrid1.LayoutSettings.InitialView = GridInitialView.GridView;
WebGrid1.AllowPivotCharting = true;
Pivot Chart View Exclusive
Pivot Chart View exclusive means that the WebGrid will show only Pivot Chart View, you won’t be able to switch between views with this view mode.WebGrid1.LayoutSettings.InitialView = ISNet.WebUI.WebGrid.GridInitialView.PivotChartViewExclusive;
Both View
Both view means that you can show both Grid View and Pivot Chart View at the same time.WebGrid1.LayoutSettings.InitialView = ISNet.WebUI.WebGrid.GridInitialView.Both;
WebGrid1.LayoutSettings.ChartDisplayPosition = ISNet.WebUI.WebGrid.ChartPosition.Top;
With just these two steps now you already have a Pivot Charting feature in your application.
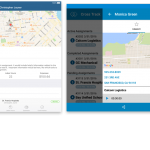
Let say you use the following settings:
WebGrid’s data source : Northwind [Order Details]
WebGrid’s Initial View : PivotChartViewExclusive
You’ll get something like this:

Done! You’ve created your first basic Pivot Charting application. This view is still meaningless, since no data / settings are applied. Let’s start dragging some Field to drop zones.
- Drag and drop OrderID to Drop Data zone.
- Drag and drop EmployeeID to Drop Category zone.
- Drag and drop OrderDate (Years) to Drop Series zone.
- Try filtering the data based on EmployeeID by clicking the “down arrow” at EmployeeID’s Pivot Object.

Note that you can also specify this settings programmatically, so at start up the user will be shown this chart automatically.
That’s all for now, in the next post I’ll discuss more about built-in features in Pivot Charting.