A Sneak Peek at ClientUI vNext
While most of our recent blog posts were targeting Crosslight, that doesn’t mean we forget our other lineups. Quite the contrary, we will have big updates to all our lineups in the upcoming release, including WebUI and ClientUI across all the 7 platforms we supported. So, if you’re building Silverlight and/or WPF applications, then this blog post is for you! I’m thrilled to share with you many exciting features that you can expect in the next release of ClientUI. Read on.
Last year, we brought you the reporting suite that changed how you build and author enterprise reports on the Silverlight platform. It’s a game-changer. Comes with true WYSIWYG experience, it allows you to author exactly the way you want your report to be. And now, for the first time ever, we’re bringing you the same, great reporting suite on the Desktop. Say hello to ClientUI Reporting for WPF.
All the great features you love. Even better.
WPF has been and will continue to be a great platform for line-of-business applications. Microsoft has stated it very clear that WPF isn’t going away anytime soon as it’s the heart of the Windows itself, particularly on the recent paradigm shift in Windows 10 which puts everything back to the desktop mode. Similarly at Intersoft, we remain committed to continue improving and expanding our WPF toolset further. In overall, we have very exciting roadmap for the Windows platform, but I couldn’t unveil that yet at this time.
As the result of our commitment, the upcoming release will include a major update to ClientUI where we’ll be strongly focused in enterprise-grade components. In particular, we’ll be making available our ClientUI Reporting suite entirely to WPF. All the reports you have authored in Silverlight will continue to work in exactly the same way and manner in WPF.
Before I delve further, let’s get some refresh on the excellent features currently offered in the Reporting suite.
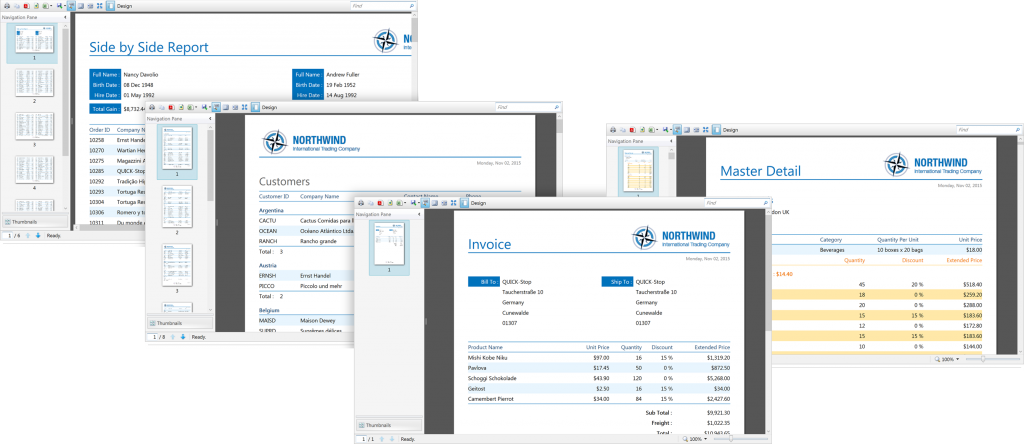
Various report types support.
Create any reports you like, from simple listing, multiple reports, invoice, master detail, group, hierarchical, table, label, to form and side-by-side reports, and much more.
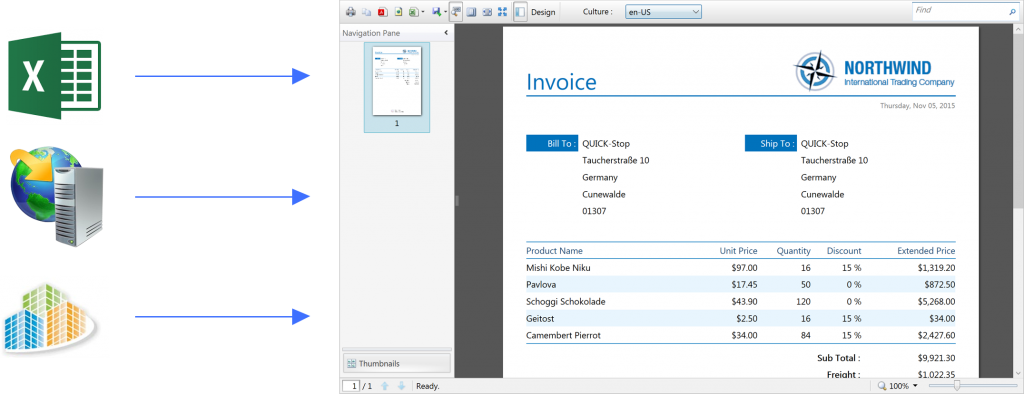
Datasource-agnostic.
Built for ultimate flexibility. You can connect to any datasource as long as they are reachable – from web services, Web API, WCF RIA Services, DevForce, to virtually any objects that can be serialized over the wire.
Complex data operation support.
Perform any complex data operation, completely run on the server-side, such as filtering, sorting and grouping.

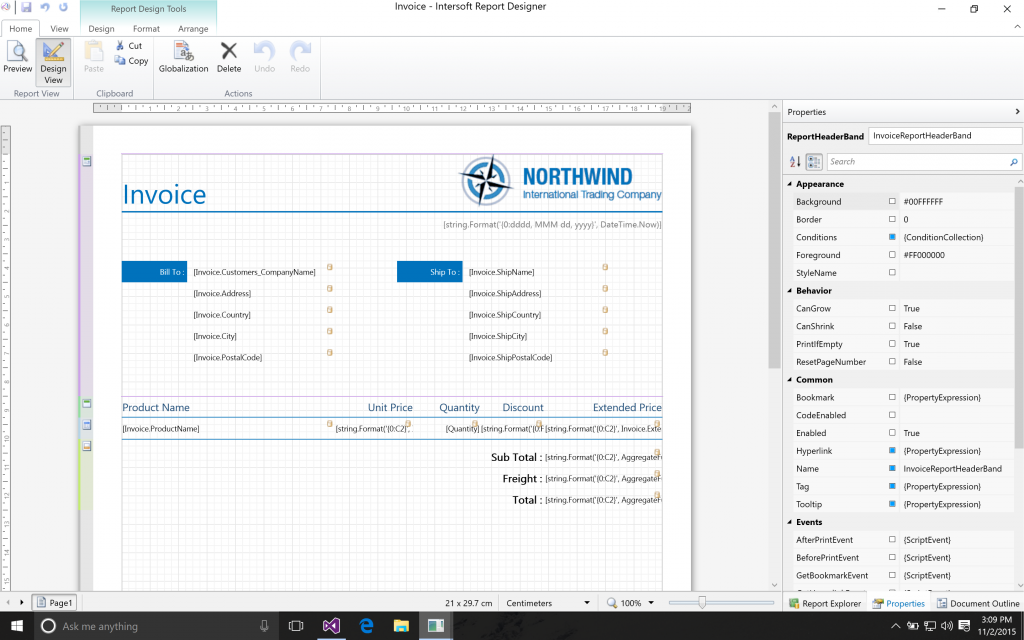
Rich report components.
Utilize all of the report bands and components to make great-looking reports that will look good on any device.
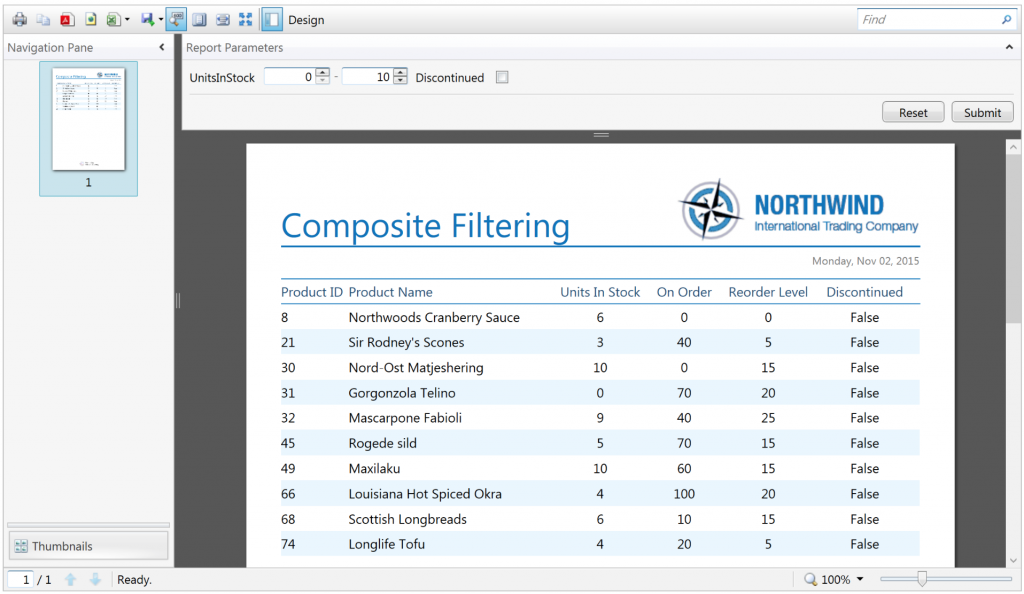
Comprehensive report parameter support.
Pass any data as report parameters to be included in report rendering process. Native data types will be automatically associated with suitable editors. You can also easily perform any custom logic based on the given report parameters.
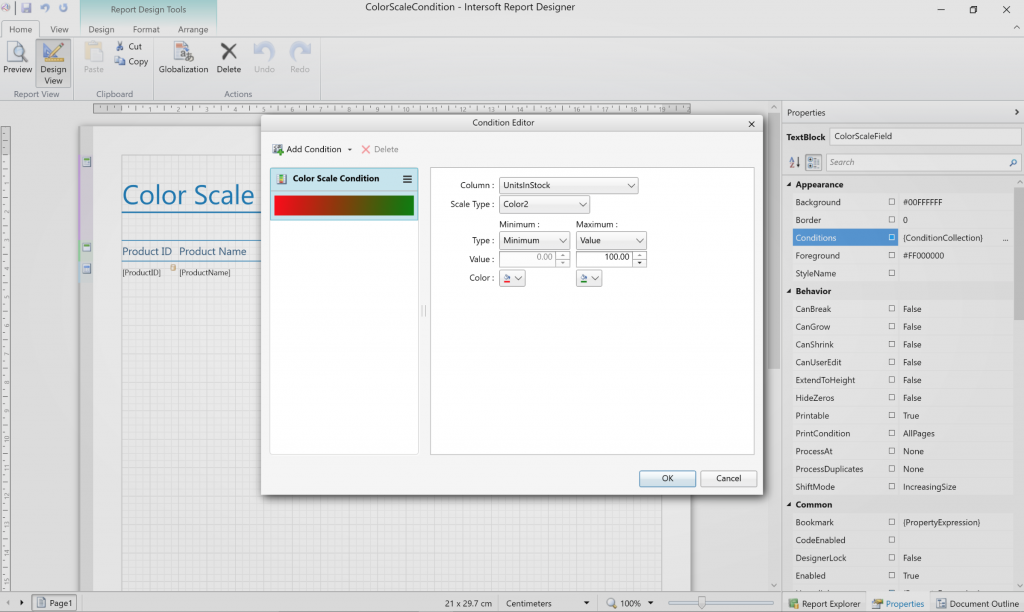
Pre-built conditional formatting.
Change the appearance of report components depending on predefined conditions. For example, you can highlight several data bands in red, allowing the user to take notice whenever a certain condition is met, like when an item’s Quantity in Stock is reaching depletion. You can also display different conditions, such as data bar, color scale and icon set conditions.
Advanced globalization support.
Reports run in multiple cultures and localization support. Your reports now speak with the reader’s native language. Confusion averted.

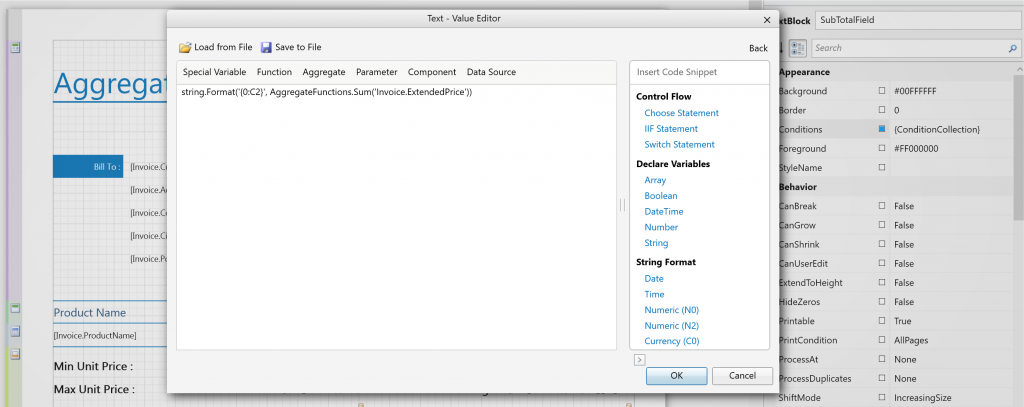
Powerful scripting capability.
Fully supports ClientUI powerful C#-style scripting, allowing you to perform any complex operations within the report document. The scripting feels natural and uses similar C# scripting language. You can use the full array of mathematics operation similar to the ones found in System.Math library.
That’s just a handful of features that I could mention here. For the complete feature list, please check it out here.
Faster. Snappier. Desktop-class performance.
Authoring enterprise reports on Silverlight is fast. On the desktop? It’s lightning fast. Harnessing the CPU cores as optimal as possible, we use the best algorithms to max out the reporting suite performance on the desktop. It’s all thanks to our team of expert engineers.
Charts. Right in Your Reports.
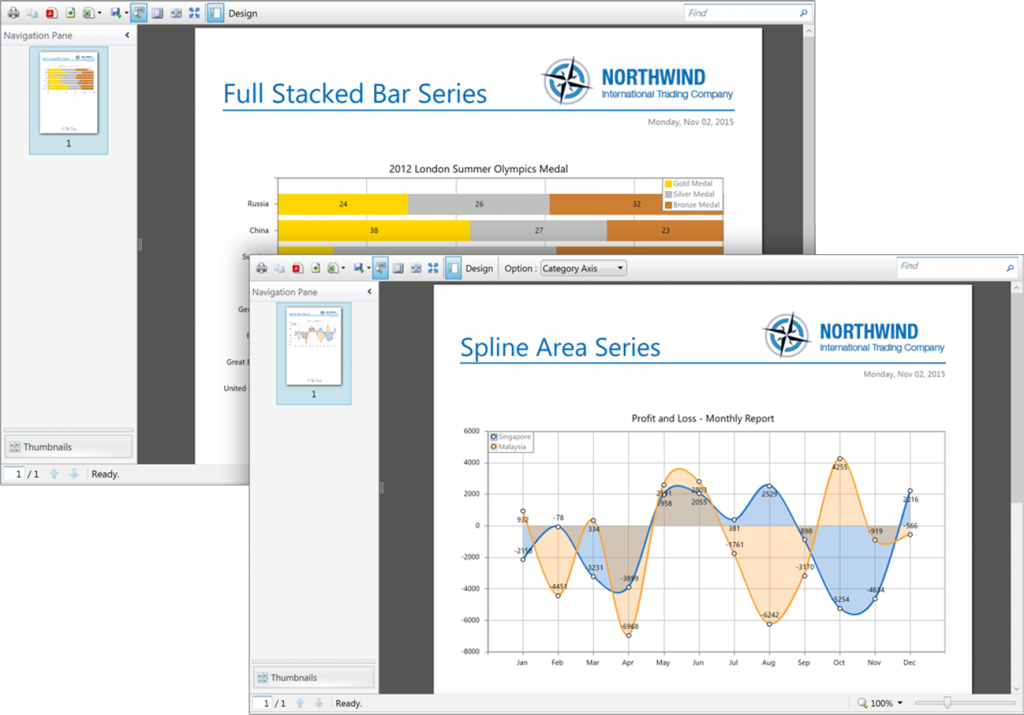
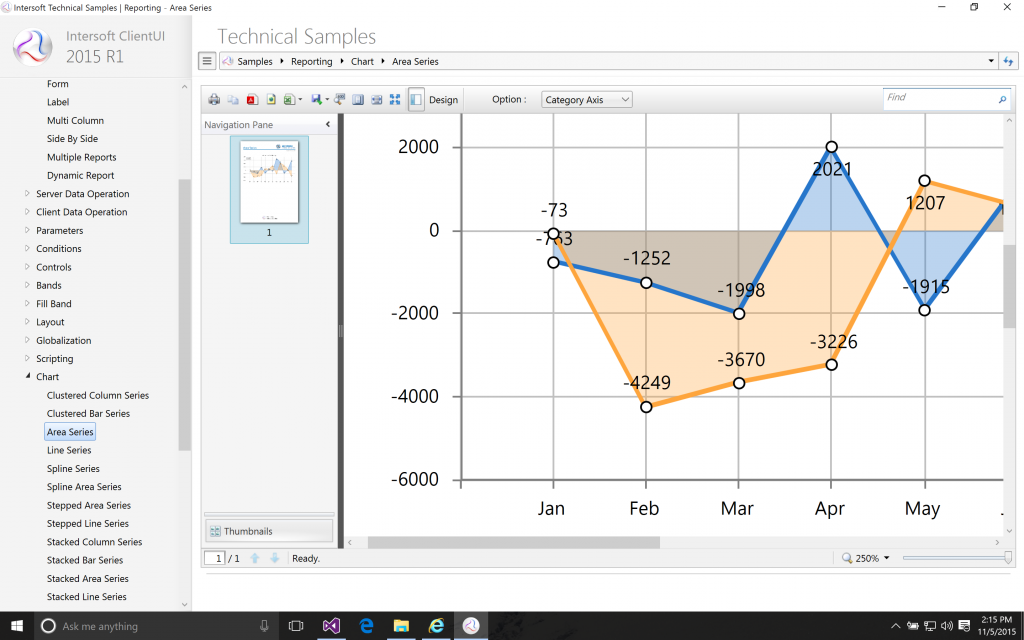
The long-awaited, Charting for ClientUI Reporting is finally here! With the new and improved ClientUI reporting, we not only add support for the desktop, we also added a set of new features that you will absolutely love: you can now display gorgeous charts right within the reports.
You can now easily add various charts to your reports, such as area, bar, bubble, column, doughnut, line, pie, scatter, spline, and more. This opens up a plethora of new business scenarios in which visual charts might be favorable compared to data grid-based reports.
Optimized for Windows 10.
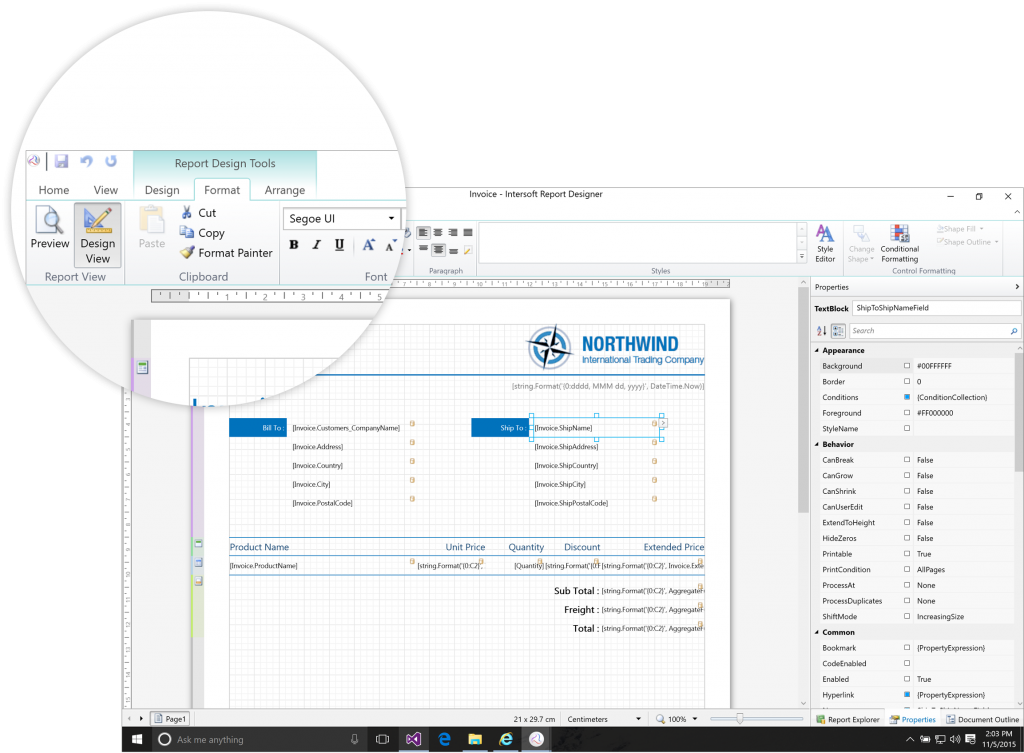
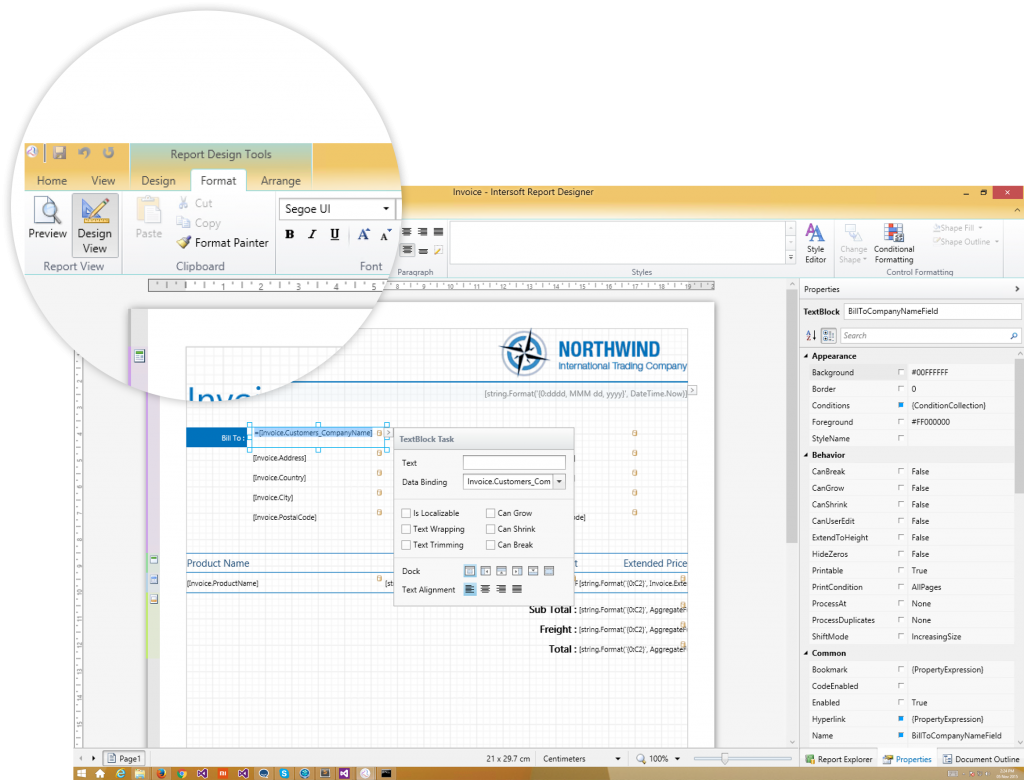
The new ClientUI Reporting experience is now optimized for Windows 10. Pay attention to the ribbon experience and see how it fits and blends with the overall Windows 10 aesthetics. You’ll begin to appreciate the small details in the engineering effort we’ve put so much into this remarkable reporting suite.
The reporting suite has been tested with previous versions of Windows and still retains the same great look and fidelity.
Built for Your Eyes.
Our team of engineers used only the best-looking interface and rendering engine algorithm available, so it looks pixel-perfect and ultra-crisp, even if you’re running the reporting suite on a computer with a powerful display. To make that happen, we’ve fine-tuned every single ClientUI component – topping over 360 components – to work and look great on WPF.
See the result when the the reporting viewer running the chart is zoomed all the way to its maximum value of 250%.
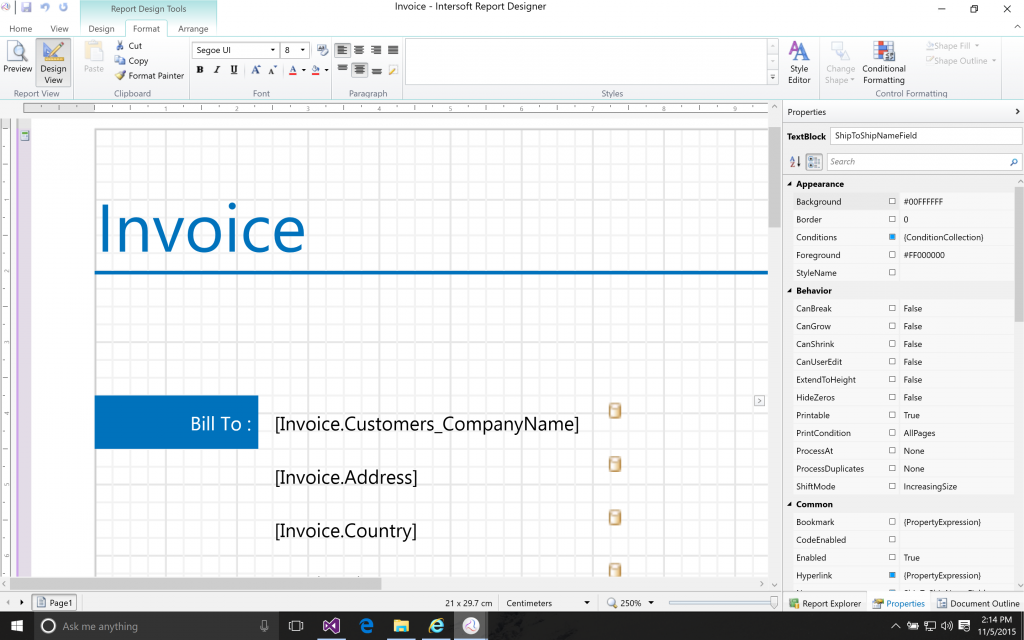
The reporting designer also retains the same great fidelity if the designer surface is zoomed all the way to its maximum value.
It won’t be long. Coming soon in 2015 R2.
We promise you it will be worth the wait. With the new ClientUI Reporting, we’re proud to say this is the most comprehensive and unmatched reporting suite in its class. With the power of desktop-class reporting engine, you can now author reports even faster and even add charts to it!
To get this feature immediately when it’s released, make sure your subscription is active by renewing your subscription today. In case your subscriptions have lapsed, please chat with us for special subscriber promotions we’re running this month.
Cheers,
Nicholas Lie


I’m a bit confused…
You say: “And now, for the first time ever, we’re bringing you the same, great reporting suite on the Desktop. Say hello to ClientUI Reporting for WPF.”
And back a few years ago: “…we also delivered the new Reporting lineup which is a huge addition to the existing Silverlight and WPF portfolio” in Intersoft Studio 2013 announcement; then ClientUI Reporting 2.0 on 2013 R2.
So when you said back then that ClientUI Reporting was a huge addition to the SL and WPF portfolio you meant SL only?! Cause if it was added for WPF in 2013, what are you adding now?
Honestly, I don’t see much for ClientUI and specifically for WPF. Your product which was a great offering back then is now an outdated deception.
Hi David, thank you for your feedback. The reporting state for WPF back then in 2013 was very different with what we have today. We’ve added a multitude of features to the reporting suite, and in this release, we’ll be adding dozens of new charts with a vast of customizable configuration, which we believe our customers will find them to be huge addition.
More importantly, particularly for WPF, we have improved the overall control performance and reliability significantly in the upcoming release. In essence, the upcoming ClientUI release reflects upon our refreshed goal to make WPF the first-class citizen for enterprise application development.
This post only covers the surface of what we will deliver in the next release of ClientUI. Stay tuned for our next update!