ClientUI Reporting is Coming in 2013 R1 – Part 2
As we are heading toward R1 release, you may expect to hear more about ClientUI Reporting. Continued from my previous post, I will expose some interesting features in our Report Designer which will ship along with the report viewer. With the built-in design tool, definitely you can create a stunning report in a short time without spend too much hard work. Our engineering team also have put so much thoughts on these, so that it has great usability and superior user experiences. Featuring industrial-standards user interface, definitely you will be more convenient with such a powerful and visually attractive design workspace.
Introducing Industry’s Most Advanced Report Designer
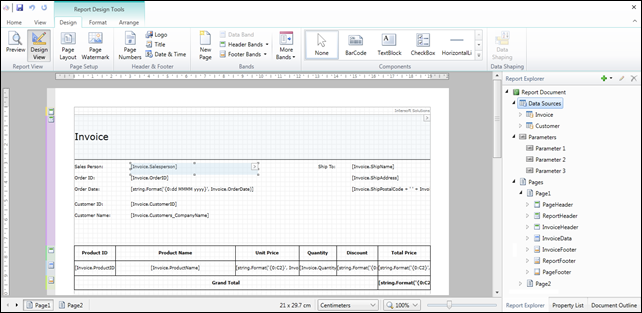
ClientUI Report Designer is built from the ground up with modern design workspace that emphasize on true WYSIWYG experience. Unlike traditional designers, ClientUI report designer features clutter-less surface that allows you to work with the report elements as if they were in an actual page. This means that you will not see any designer-related visual adorners getting in the way on the designer surface. Instead, we created gorgeous visual adorners on the left side of the report with distinguished colors allowing you easily recognize each report section defined in the page.
We streamlined the overall report authoring process by arranging most frequently accessed commands in three major workflows represented in the ribbon tab group: Design, Format and Arrange. The Design tab lets you easily insert new report elements, while the Format and Arrange tabs let you quickly beautify the report elements. Everything is thoughtfully designed so both end users and developers will find the report designer very intuitive and pleasant to be used. See the following screenshot for the visual details.
As seen in the above image, the Report Explorer tab on the right will show the report’s hierarchy. Inside there, you can see the already defined data sources and parameters. All report components also will be listed here. In addition, you can also perform various operations, such as add, edit, or delete, for each data source or parameter.
Advanced Property Editing
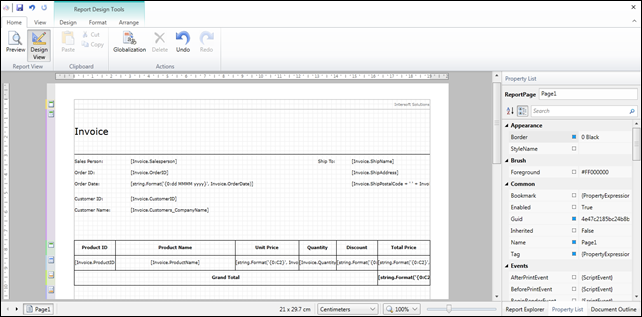
Handling vary types of object with it’s specific editor is not an easy task. A report component has a lot of properties which is difference from each others. In this scenario, performance issue need to be considered. To overcome it without performance degradation, Report Designer employs the most advanced property editing control, UXPropertyGrid. The property grid features high-performance UI virtualization that allows blazing-fast properties listing and rendering when you select an object. See the following screenshot.
Independent Data Source Provider
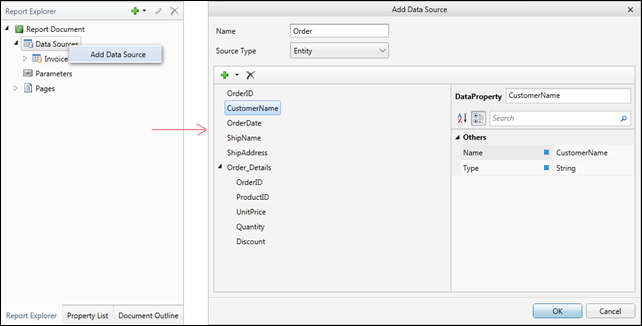
Discussing about a report, you must be aware about the data source. As stated before, there are literally no constraints about the data source you should use, so you can utilize any kinds of data. All you need here is only to define the data definitions. You can define it manually like the following illustration.
But it would be very inconvenient if you need to specify a lot of data definitions manually. Actually you can import the definitions from a generated WCF RIA or DevForce assembly, without specifying it one by one. See the following illustration.
Powerful Design Tool with Drag-Drop Functionality
Drag and drop is one of the key feature in report designer. Report designing task will become more easy and simple with this functionality introduced. Various complex actions, such as object positioning, object creation, data field sorting, and much more, which usually need 3 or more actions to perform it, can be achieved elegantly by using drag-drop. Thanks to ClientUI’s robust Drag-Drop Framework, so our teams can quickly provide fluid drag-drop capabilities for the Report Designer.
Precise Layouting with Guidance Ruler and Snap to Grid Feature
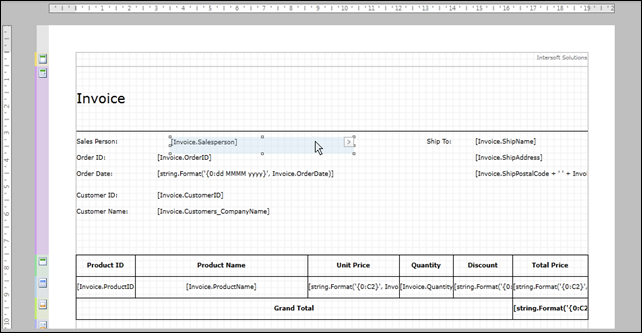
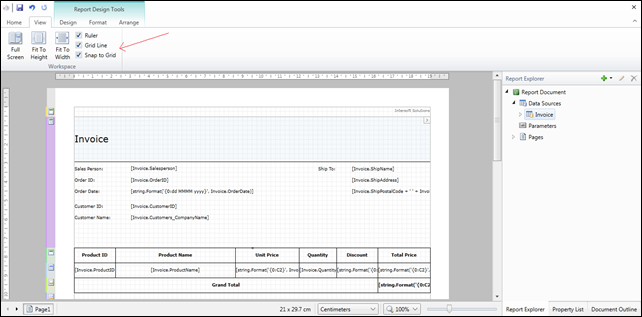
Layouting is the most important step while creating a report, which will affects the final result. For some scenario, guidance ruler will be very helpful, especially for object positioning. As you can see on the below screenshot, those rulers are placed on top and left side of the design surface. Besides that, you can also enable Snap-to-Grid feature, which allowed you to precisely resize or move objects to a specific location.
Create Report Efficiently using Smart Tag
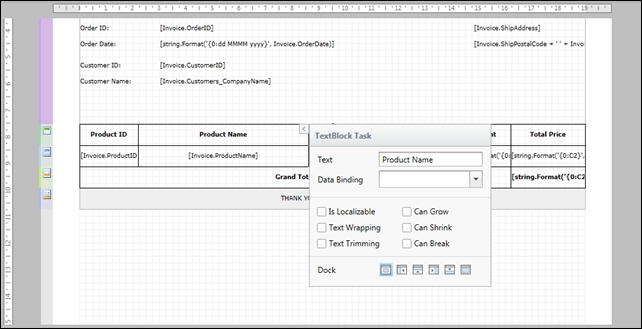
To create a report fast and more efficiently, you can take advantage of using the smart tag. Actually the smart tag has been designed to display some actions which is basically needed in most business scenario. It can save your time a lot rather than browse it from the property list.
Undo/Redo Capability
Undo/Redo is a very useful feature in Report Designer. As the name explains, it allows you to undo/redo a number of recent actions. Suppose you accidentally delete an object or something else, these actions still can be reverted easily.
Preview Report at Design Time
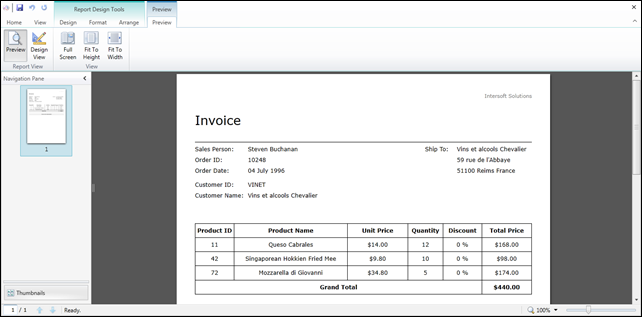
Another important feature not to be missed is the ability to preview a report at design time, because the iterative process of perfecting a report is accomplished by moving back and forth between the Preview and Design section. Of course, the preview section will show the result exactly the same as when it is printed. See the screenshot below.
Okay, I think it’s enough although there are still so much exciting stuff about the Report Designer. I’d love to hear if you have any comments, questions or feedback about our Report Designer. Thank you for reading and stay tuned for the next update.
Warm Regards,
Jack

So, we are into August now, when can we expect a version to try? What I saw was this would be released by end of July.
@Simon: Thanks for continuous interest in our Reporting lineup. Please bear with us a little while longer as we’re preparing for the biggest product release ever.
The reporting will ship with world-class designer features with industrial standards design, we expect it to be ready later this month.