Create Drill Down Chart with UXChart
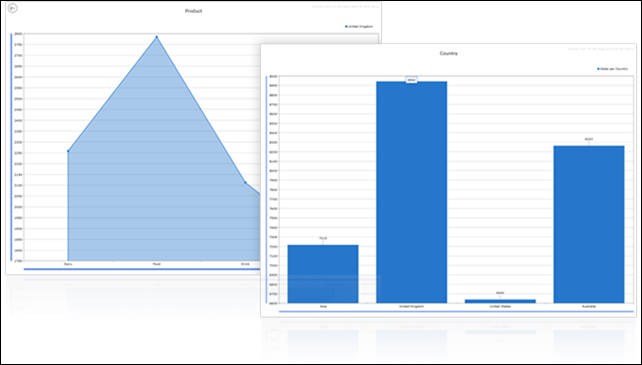
Quite often, you will need to allow your user to drill-down data from yearly data to monthly or from categories to individual items. Now it’s very easy with our new concept which gives you freedom to create unlimited levels of drill-down charts from a single data source in minutes.
In this blog post, I want to show an example of drilling down chart data, i.e. to display master-detail data in the same chart, by clicking a point of the first series will let another series shown, which represents detailed data related to the selected point. This is critical for creating interesting and fun charts to interact with. This blog entry includes basic knowledge of what you can do with our chart right out of the box. See the following screenshot for the drilling down chart that we want to create.
To get started, we use the Child properties in UXChart to specify which chart that we want to display as detail of origin chart. Specifically, all charting collections must be defined in View in a first place. On first load, you are allowed to display one chart only, and the others’ visibility must be set to collapse. See the code below:
|
1 2 3 4 5 6 |
<dataVisualisation:UXChart x:Name="Chart1" Visibility="Visible" Child="{Binding ElementName=Chart2}" DrillDownCommand="{Binding DrillDownCommand}"> </dataVisualisation:UXChart> <dataVisualisation:UXChart x:Name="Chart2" Visibility="Collapsed" > </dataVisualisation:UXChart> |
Next, we need to hook our custom command to control the drilldown action, we called it DrillDownCommand.
|
1 |
public DelegateCommand DrillDownCommand { get; set; } |
And then we assign DrillDownCommand to some execute the method in our ViewModel.
|
1 |
this.DrillDownCommand = new DelegateCommand(ExecuteDrillDown); |
In the execute method, we can initialize the data from the data source and retrieve detail information about the chart itself.
|
1 2 3 4 5 6 7 8 9 10 11 12 13 |
private void ExecuteDrillDown(object parameter) { UXChartDrillDownCommandArgs args = parameter as UXChartDrillDownCommandArgs; if (args.Level == 1) { Data parent = args.DataPointContext as Data; if (parent != null) { InitializeDataByArea(parent.Area); } } } |
In conclusion, with simple implementation, we already make drill down function very simple and effortless. Now feel free to try and make your very own drill down chart. There’s unlimited level that you can figure out and explore.
For more information about our ClientUI control in Silverlight & WPF, please refer to the online documentation. You can download our sample here. Feel free to drop us any questions or feedback.
Till we meet again.
Cheers,
Yanes


